Data‑driven insights, not just dashboards
Business Intelligence & Analytics Portfolio
A curated collection of BI dashboards and analytical solutions designed to transform raw data into clear, actionable decisions.
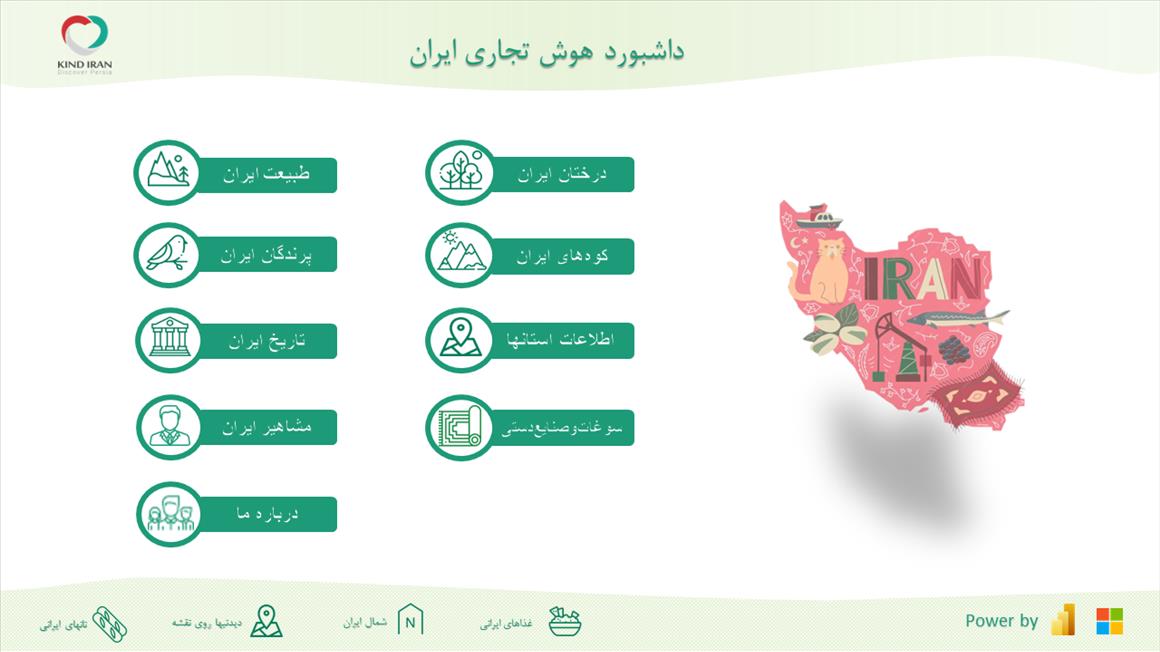

Iran business intelligence Dashboard
Iran's business intelligence dashboard is designed based on the historical, nature and cultural information of Iran, which makes it easy for you to access more than 100,000 data so that you can make decisions more easily or gain special knowledge.

World intelligence Dashboard
Our Global Statistics and Information Dashboard comprises several key sections, detailed as follows:Comprehensive Statistics and Information,Distance Calculation Between Countries,Local Time and Clock,UNESCO World Heritage


Perfume sales dashboard
The perfume sales management dashboard has been prepared in order to check the amount of perfume sales from different parameters such as geographic region, date of sale, sellers, buyers, perfume brand..

Dental Clinic Performance Dashboard
Dental information dashboard that includes a part of patient referrals, treatments, teeth information and their paid expenses over 10 years, you can see the results obtained from this information in this dashboard.

IMDB Movies Dashboard
Filter and sort over 480,000 movies from 250 countries and 126 years. Visit IMDB pages by clicking titles. Enjoy cinema history!
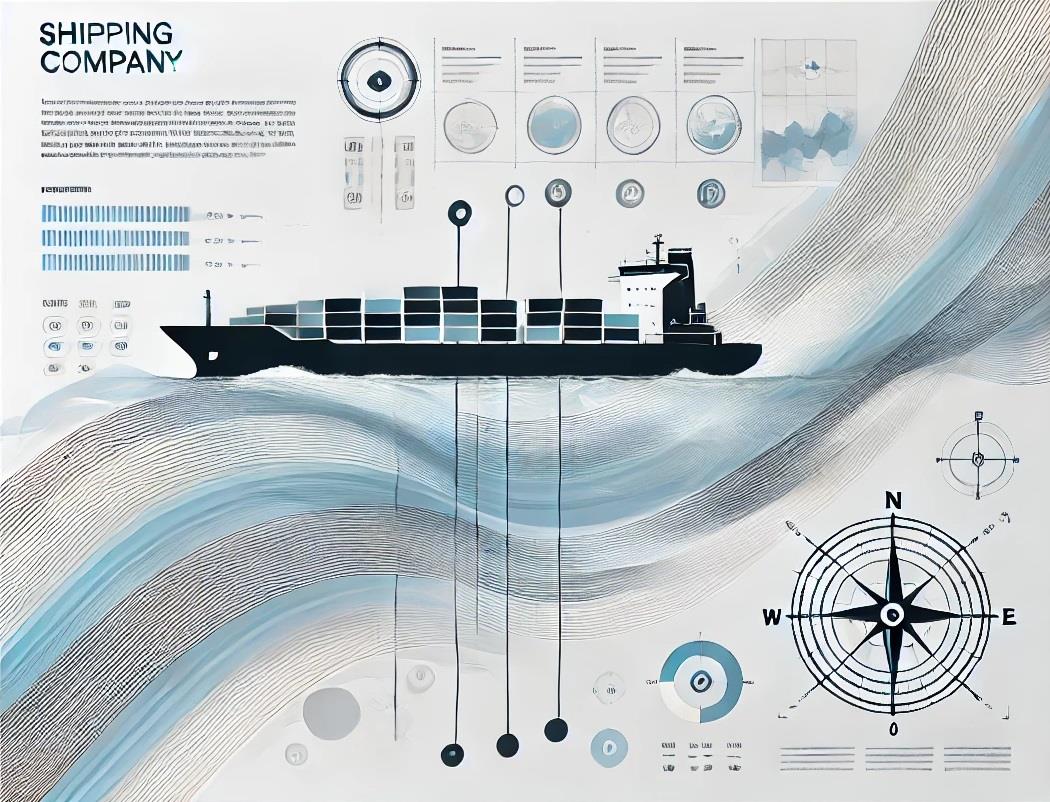
Analysis of the shipping company
A business intelligence dashboard analyzing maritime cargo shipments to Iran, focusing on order registration, payment status, invoices, and sales representatives.
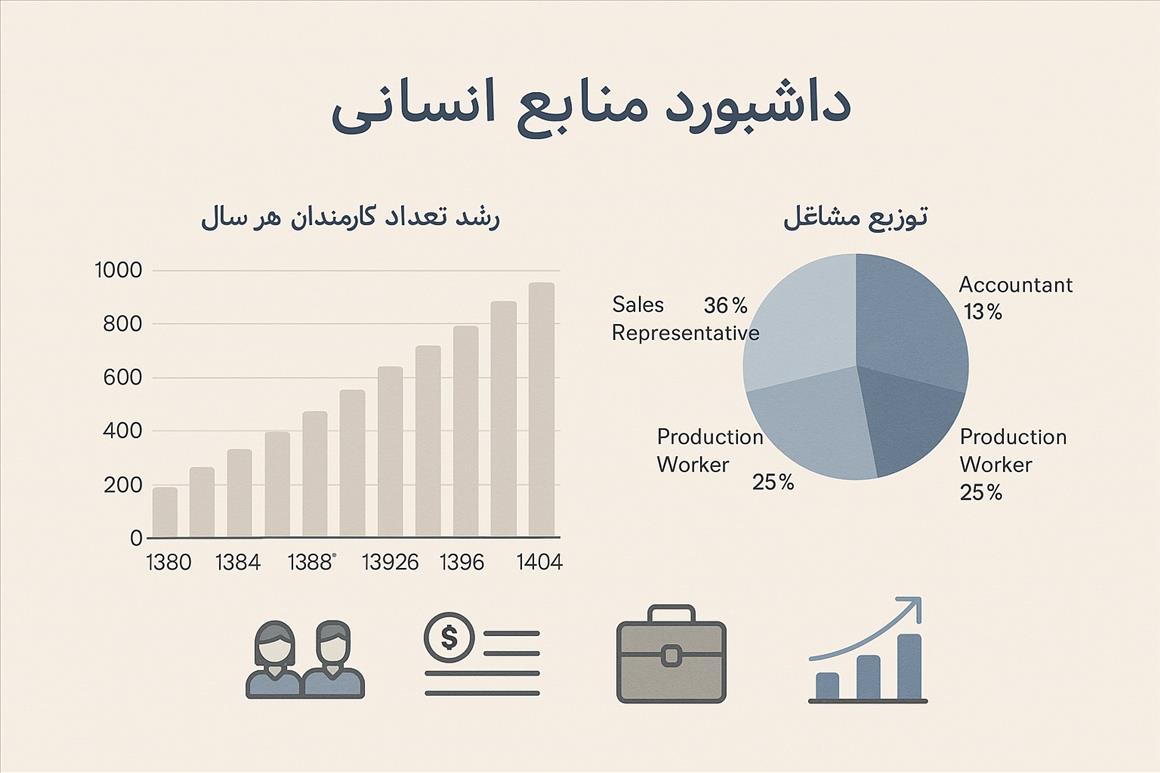
Pharma HR Dashboard
A comprehensive HR dashboard for a pharmaceutical import company, focused on structure, trends, and data-driven insights.

Tehran Home Metrics BI Dashboard
aThis dashboard analyzes 94,000 properties in Tehran based on region, neighborhood, size, building age, price, and amenities, providing precise insights for better decision-making.

Vancouver Crime Information Dashboard
I created a dashboard that analyzes 883K crimes in Vancouver over 21 years, using data from the police department. The dashboard allows you to explore and compare the crime data by various factors, such as time, location, type, and severity.


Electric Vehicle Analysis
An analytical dashboard for the electric vehicle market, focusing on sales trends, top manufacturers’ market share, average vehicle price, and market growth analysis from 1997 to 2023.

Udemy Course Performance Dashboard
An interactive analytics dashboard analyzing Udemy course revenue, subscribers, pricing strategies, and growth trends. This dashboard uncovers key insights into free vs paid courses, learner preferences across skill levels.